
Perf 使用注意事项
(perf 工具的基本用法可参考官方教程,本文不再涉及。)
当前 RISC-V 对 perf 的支持涉及以下软/硬件的框架/规范:
- Linux perf 框架
- perf 框架主体
- perf 工具的 pmu-events json 文件(允许 perf 工具以名字而非 raw 编码指定硬件平台所支持的特定事件)
- SBI PMU Extension
- RISC-V 硬件规范
- RISC-V ISA Privileged Specification 中定义的 HPM(Hardware Performance Monitor)内容
- Sscofpmf Extension
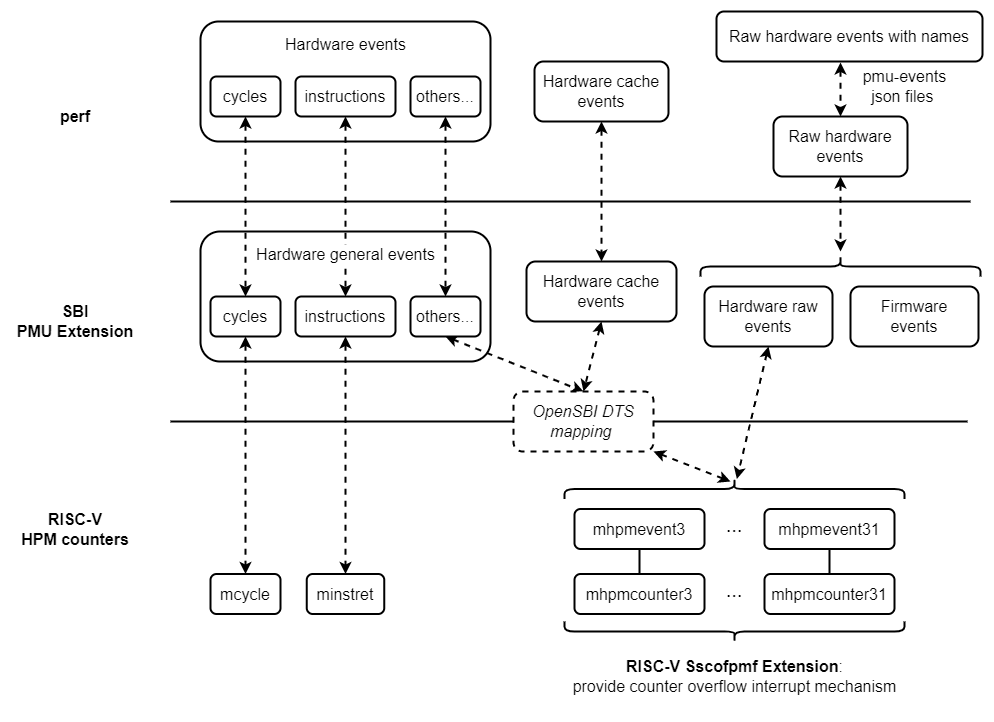
它们的关系如下:
但即��使软/硬件上全都支持了以上内容,仍存在以下事项需 perf 的使用者关注:
perf list 所列出的硬件事件不一定全都可用
现象:
perf list 列出的硬件事件,并不表示当前硬件平台就全都支持这些事件。
例如,perf list 列出的硬件事件如下:
$ perf list | grep Hardware
  branch-instructions OR branches                    [Hardware event]
  branch-misses                                      [Hardware event]
  bus-cycles                                         [Hardware event]
  cache-misses                                       [Hardware event]
  cache-references                                   [Hardware event]
  cpu-cycles OR cycles                               [Hardware event]
  instructions                                       [Hardware event]
  ref-cycles                                         [Hardware event]
  stalled-cycles-backend OR idle-cycles-backend      [Hardware event]
  stalled-cycles-frontend OR idle-cycles-frontend    [Hardware event]
  L1-dcache-load-misses                              [Hardware cache event]
  L1-dcache-loads                                    [Hardware cache event]
  L1-dcache-prefetch-misses                          [Hardware cache event]
  L1-dcache-prefetches                               [Hardware cache event]
  L1-dcache-store-misses                             [Hardware cache event]
  L1-dcache-stores                                   [Hardware cache event]
  L1-icache-load-misses                              [Hardware cache event]
  L1-icache-loads                                    [Hardware cache event]
  L1-icache-prefetch-misses                          [Hardware cache event]
  L1-icache-prefetches                               [Hardware cache event]
  LLC-load-misses                                    [Hardware cache event]
  LLC-loads                                          [Hardware cache event]
  LLC-prefetch-misses                                [Hardware cache event]
  LLC-prefetches                                     [Hardware cache event]
  LLC-store-misses                                   [Hardware cache event]
  LLC-stores                                         [Hardware cache event]
  branch-load-misses                                 [Hardware cache event]
  branch-loads                                       [Hardware cache event]
  dTLB-load-misses                                   [Hardware cache event]
  dTLB-loads                                         [Hardware cache event]
  dTLB-prefetch-misses                               [Hardware cache event]
  dTLB-prefetches                                    [Hardware cache event]
  dTLB-store-misses                                  [Hardware cache event]
  dTLB-stores                                        [Hardware cache event]
  iTLB-load-misses                                   [Hardware cache event]
  iTLB-loads                                         [Hardware cache event]
  node-load-misses                                   [Hardware cache event]
  node-loads                                         [Hardware cache event]
  node-prefetch-misses                               [Hardware cache event]
  node-prefetches                                    [Hardware cache event]
  node-store-misses                                  [Hardware cache event]
  node-stores                                        [Hardware cache event]
但对某些事件的计数结果会显示 <not counted> ,有可能当前硬件平台不支持该事件(但也有可能是支�持该事件但没统计到计数):
$ perf stat -e cycles,branches,bus-cycles,ref-cycles ls

 Performance counter stats for 'ls':

           1719370      cycles
             94325      branches
     <not counted>      bus-cycles                                (0.00%)
     <not counted>      ref-cycles                                (0.00%)

       0.002556584 seconds time elapsed

       0.002900000 seconds user
       0.000000000 seconds sys
原因:
perf list 列出�的 “Hardware event” 和 “Hardware cache event” 是 Linux perf 框架中预设好的硬件事件名字,在 RISC-V 平台中它们是通过 SBI PMU Extension 与实际的 HPM 硬件计数器建立起联系。而在 OpenSBI 的 PMU Extension 实现中,这种映射关系是描述在 Device Tree 中 compatible = "riscv,pmu" 的字段中。
以下是一个 Device Tree 的例子:
pmu {
    compatible = "riscv,pmu";

    riscv,event-to-mhpmevent =
    /* BRANCH_INSTRUCTIONS */
    <0x00005 0x0 0x01>,
    /* BRANCH_MISSES */
    <0x00006 0x0 0x02>,
    /* STALLED_CYCLES_FRONTEND */
    <0x00008 0x0 0x03>,
    /* STALLED_CYCLES_BACKEND */
    <0x00009 0x0 0x04>,
    /* L1D_READ_ACCESS */
    <0x10000 0x0 0x06>,
    /* L1D_READ_MISS */
    <0x10001 0x0 0x05>,
    /* L1D_WRITE_ACCESS */
    <0x10002 0x0 0x0a>,
    /* L1D_WRITE_MISS */
    <0x10003 0x0 0x09>,
    /* L1I_READ_ACCESS */
    <0x10008 0x0 0x0c>,
    /* L1I_READ_MISS */
    <0x10009 0x0 0x0b>,
    /* L1I_PREFETCH_ACCESS */
    <0x1000c 0x0 0x0e>,
    /* L1I_PREFETCH_MISS */
    <0x1000d 0x0 0x0d>,
    /* DTLB_READ_MISS */
    <0x10019 0x0 0x15>,
    /* DTLB_WRITE_MISS */
    <0x1001b 0x0 0x19>,
    /* ITLB_READ_MISS */
    <0x10021 0x0 0x1b>;

    /* 16 valid counters: mhpmcounter3 ~ mhpmcounter18 */
    riscv,event-to-mhpmcounters =
     <0x00005 0x00006 0x0007fff8>,
     <0x00008 0x00009 0x0007fff8>,
     <0x10000 0x10003 0x0007fff8>,
     <0x10008 0x10009 0x0007fff8>,
     <0x1000c 0x1000d 0x0007fff8>,
     <0x10019 0x10019 0x0007fff8>,
     <0x1001b 0x1001b 0x0007fff8>,
     <0x10021 0x10021 0x0007fff8>;

    riscv,raw-event-to-mhpmcounters =
     /*
      * For convenience, we treat 0x1~0xff as valid indexes,
      * but actually in hardware the valid indexes are 0x1~0xbd.
      */
     <0x0 0x0 0xffffffff 0xffffff00 0x0007fff8>;
};
具体的格式说明可参考 OpenSBI 源码中的文档 docs/pmu_support.md 。
Device Tree 的这些内容,是由 OpenSBI 解析,Linux perf 框架无法得知(目前没有定义相关的规范)。因此,perf list 所列出的硬件事件,并非每一个都对应硬件上实际的 HPM 事件。
X60 中 perf record 等采样统计的功能对 cycles 和 instructions 事件无效
现象:
在 X60 中,perf 中某些对硬件事件进行采样统计的功能(包括但不限于 perf record 、 perf top 等),对 cycles 和 instructions 事件无法生效。可能出现的现象包括但不限于:
-
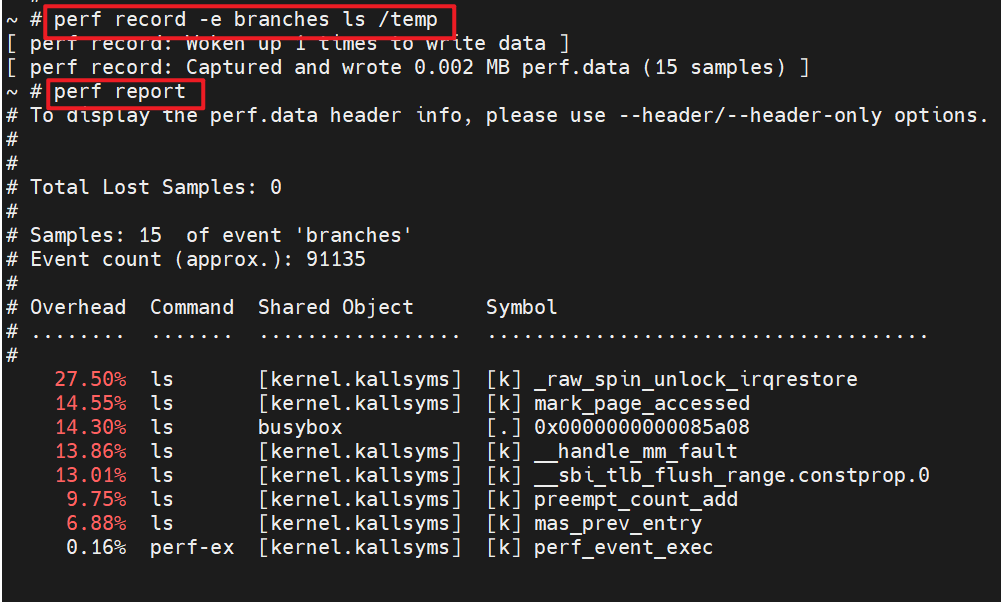
执行
perf record后,对生成的perf.data使用perf report时,报错 “The perf.data data has no samples!”。如下图:
-
执行
perf top无输出。 -
...
原因:
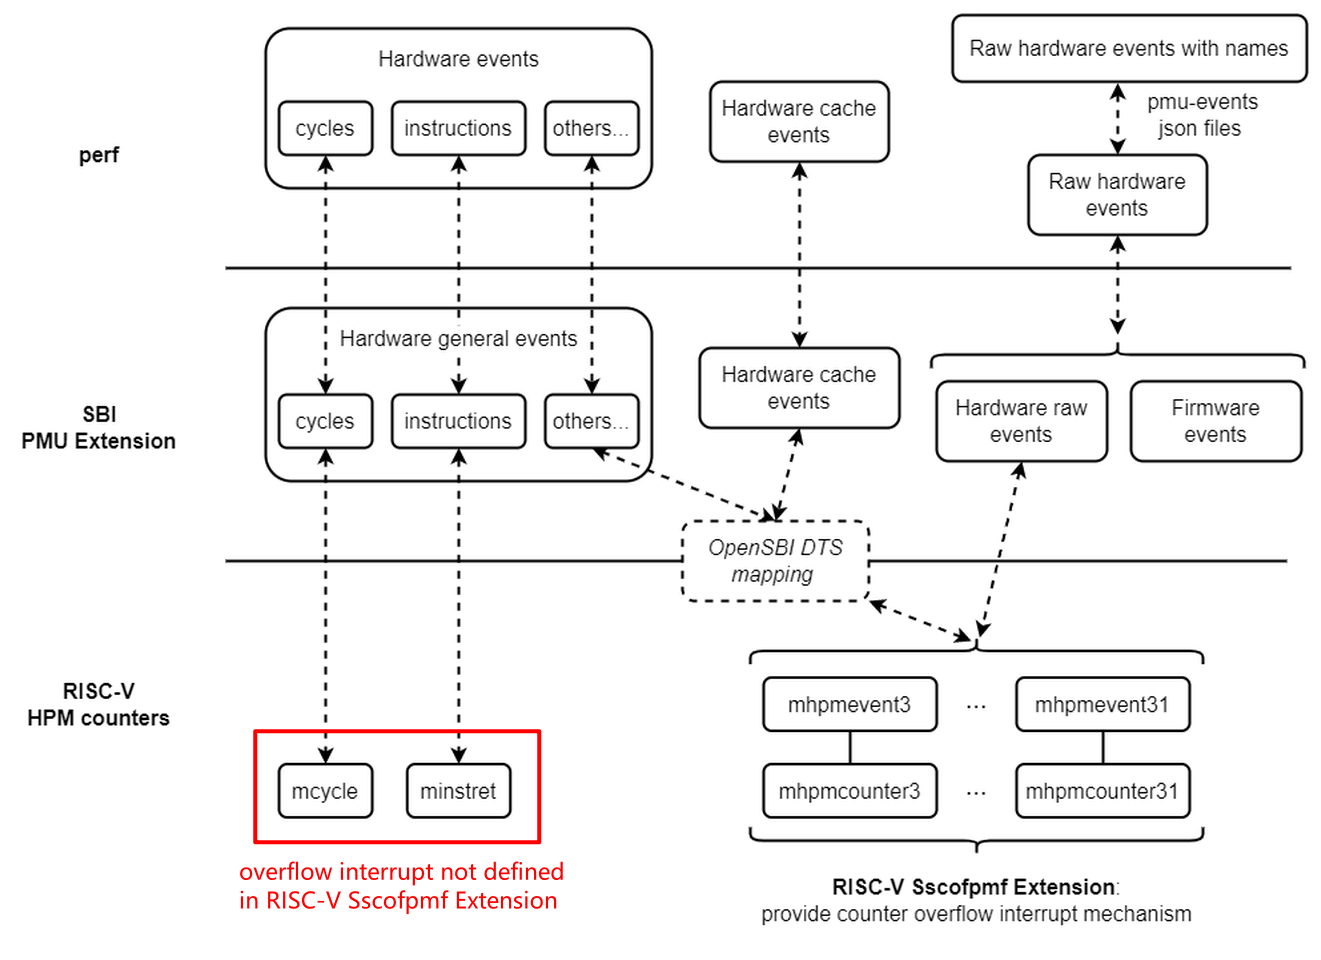
perf 的 record 、 top 等采样功能,若要统计硬件事件,需要该事件对应的硬件 counter 支持 overflow interrupt。RISC-V 的 Sscofpmf 扩展就是定义了硬件上 mhpmevent 的 counter 如何提供 overflow interrupt。
但对于 cycles 和 instructions 这两个事件所用的 counter CSR —— mcycle 和 minstret ,Sscofpmf 没有定义它们的 overflow interrupt,而 X60 也没有对此额外处理,因此这些需要采样的 perf 功能对这两个事件无效:
大多数情况下,若不使用 -e 参数手动指定事件,perf 会默认统计 cycles 事件。 因此在 X60 中,需要采样的 perf 功能默认无输出或统计结果的 samples 为 0 是正常的,并非表示 perf 不可用,只需用 -e 参数指定其他事件即可。 例如:
在 X60 中使用采样功能统计性能时,可考虑使用以下事件作为 cycles 和 instructions 的替代:
cpu-clock/task-clock等软件事件。- X60 硬件支持的一些特定事件,如 U/S/M mode cycles、不同指令的计数等(具体事件请参考相关硬件手册;如何在 perf 中使用这些事件请参考后面章节 “如何使用 raw hardware event”)。
如何使用 raw hardware event
Linux perf 框架只预设了一部分硬件事件的名字,对于那些在硬件上支持、但不存在预设名字的事件(称为 raw hardware event),可在使用 -e 参数时通过以下两种方法指定:
- 通过
rNNN编码指定。 - 通过名字指定(需要该平台的 SDK 已实现 pmu-events json 文件)。
通过 rNNN 编码指定
-e rNNN 可直接通过硬件定义的编号来指定使用哪个事件,其中 NNN 为 16 进制数字(不包含 0x ),其格式由 perf 框架、硬件定义的编码、以及相关中间层软件共同决定。
对于支持 SBI PMU Extension 的 RISC-V 平台,NNN 编码各 bit 的含义为:
  [63]      固定为 0,表示 raw type
  [52:56]   固定为 4,表示 type 为 PERF_TYPE_RAW
  [55:48]   未使用,全为 0 即可
  [47:0]    对应的 mhpmevent CSR 值
例如,r0400000000000008 表示 mhpmevent 值为 0x8 的事件。
通过名字指定
perf 工具支持一个功能,可允许在其源码目录中增加一些 json 文件,为不同硬件厂商的 raw hardware event 定义名字。如此一来,使用时可通过名字而非 rNNN 编码来指定事件。
若某一平台实现了该功能,可在其 SDK 的 Linux 源码的 tools/perf/pmu-events/arch/riscv/ 目录下找到这些 json 文件。例如 x60 的有:
user@host:~/linux/tools/perf/pmu-events/arch/riscv$ tree spacemit/x60
spacemit/x60
|-- branch.json
|-- cache.json
|-- instruction.json
`-- microarch.json
当 使用该源码编译出来的 perf 时,可以用 json 文件中定义的这些名字替换掉 rNNN 编码。
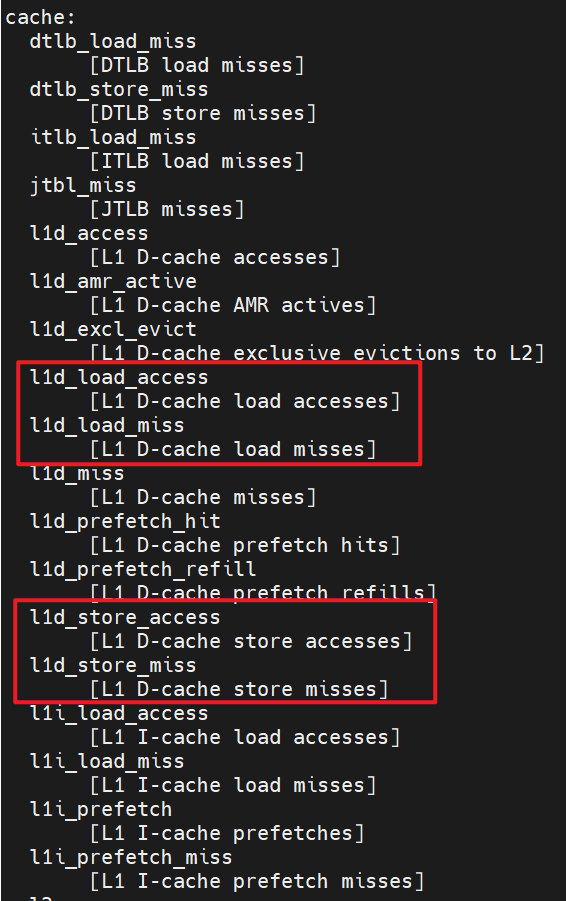
以 X60 cache.json 中的部分内容为例:
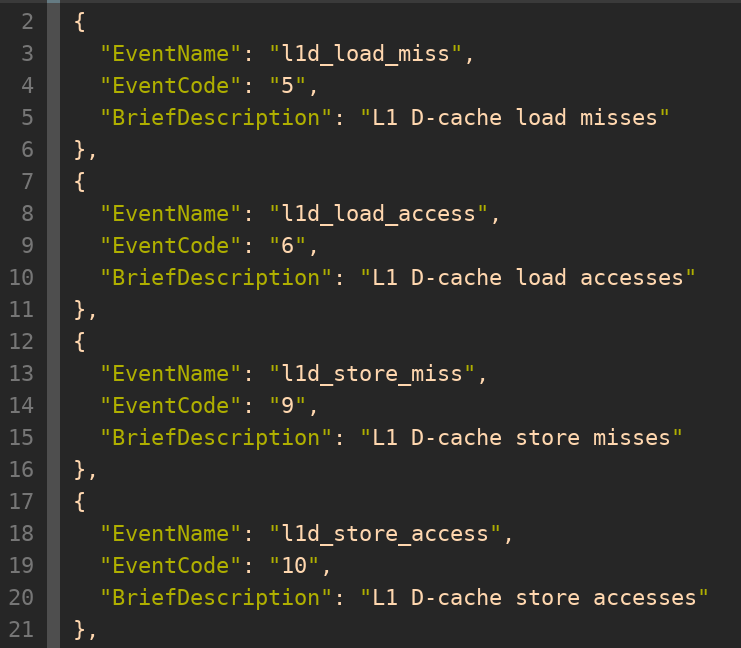
EventName是可在 perf-e参数中使用的名字。EventCode对应于硬件手册中该 HPM 事件的编号。
在 perf list 中可看到对应的名字(若 perf list 结果太长,可只列出与关键字相关的事件,例如 perf list l1 ):
该名字可直接用在 -e 参数中,如:
