Debugging Tools
1. Overview
1.1 Purpose of Writing
This manual primarily introduces the usage of SpacemiT's debugging tools to facilitate use by developers.
1.2 Scope of Application
Suitable for SpacemiT's K1 Series SoC.
1.3 Relevant Personnel
- Systems Engineer
- Application Engineer
1.4 Document Structure
This document introduces how to download OpenOCD, configure J-Link, run OpenOCD, and use GDB for software debugging.
2. Download
OpenOCD Download Path: https://archive.spacemit.com/tools/openocd
GDB is included in the cross-compilation toolchain. Please refer to the <Cross-Compilation Toolchain User Manual_>_
3. Configure USB Driver
Taking J-Link as an example, you need to configure the USB driver. Please refer to the following instructions for detailed steps.
3.1 Hardware Setup
Open the casing of the J-Link, and remove the jumper cap so that the J-Link does not supply power externally.
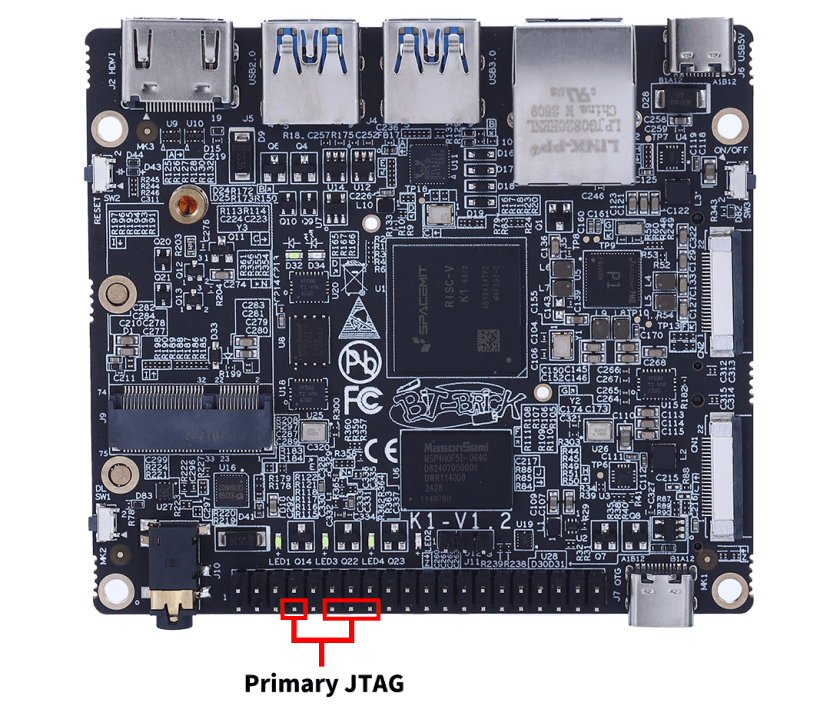
- Connect the JTAG and check whether the pins corresponding to the JTAG signals are being used. The following is the JTAG debug interface information.
K1 reserves a Primary JTAG debug channel in the 40-pin GPIO expansion interface. The pinout is as follows:
| Pin Number | Net Name | JTAG Signal Name |
|---|---|---|
| 7 | GPIO_70_3V3 | PRI_TDI |
| 11 | GPIO_71_3V3 | PRI_TMS |
| 13 | GPIO_72_3V3 | PRI_TCK |
| 15 | GPIO_73_3V3 | PRI_TDO |
3.2 Install the Driver
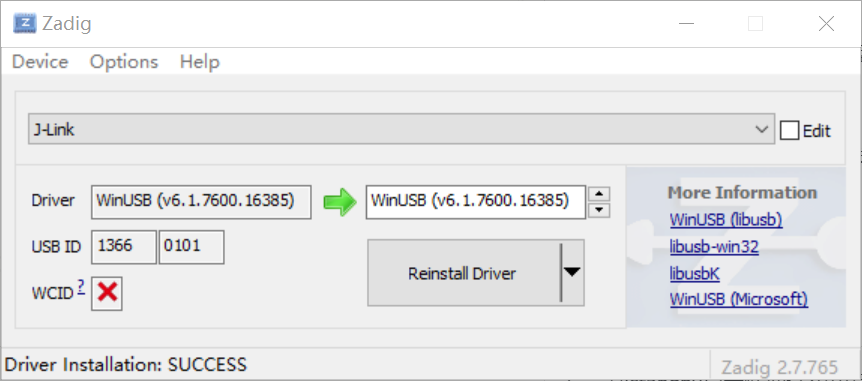
- Download the Zadig tool from the Zadig offical website and run it.
- In the Zadig tool, go to the "Options" menu and select "List All Devices."
- Check the device list, select the J-Link device, and update it to the WinUSB driver.
3.3 Select Driver
After a successful installation, you can see the J-Link device under Universal Serial Bus devices in the Device Manager.
If there are multiple drivers available (for example, the native Segger driver), upon reconnecting the J-Link, it might automatically select another driver. In this case, you need to select the WinUSB driver from the list of available drivers on your computer to update the driver.
4. Run** OpenOCD**
Assuming it is extracted to D:\spacemit-openocd-windows-v1.0.0, you can start OpenOCD by running the following command in cmd:
D:\spacemit-openocd-windows-v1.0.0\bin\openocd.exe -f D:\spacemit-openocd-windows-v1.0.0\share\openocd\scripts\board\spacemit_k1_2x4.cfg
In the above command, the configuration file for 8-core debugging is following the option -f . There is also a configuration file for single-core debugging in the same directory.
The configuration file contains the GDB debug port configuration, which can also be seen printed in the log after running. The default port is 1024.
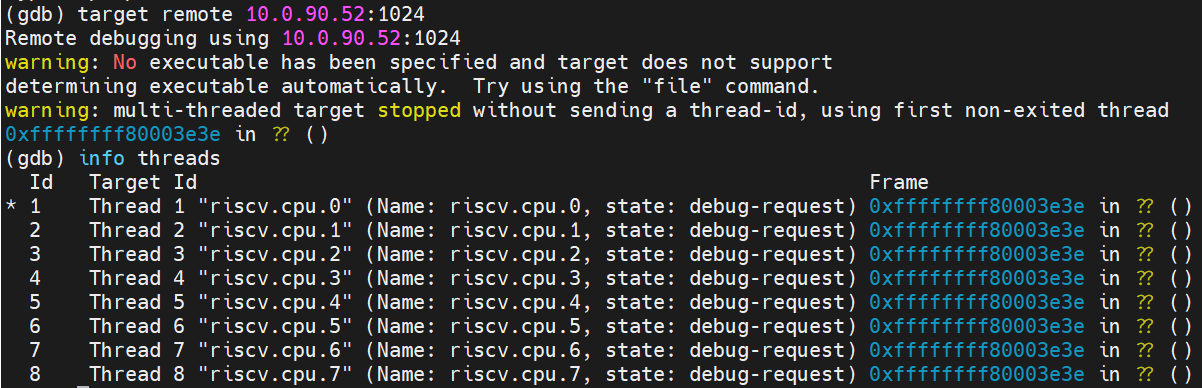
** 5. Debugging with GDB**
Using riscv64-unknown-linux-gnu-gdb, enter target remote <ip>:<port> to establish a connection between GDB and OpenOCD. Enter info threads to see that 8 threads have entered debug mode, with each thread representing a CPU core. Then, you can proceed to use standard GDB commands for debugging.